
Analytics
Every figure is a count.
Guest engagement analytics for the property, in one dashboard. Every figure on it is a count of something that happened, or a value you set yourself — nothing is modeled or projected.
What the guest sees
The guest sees none of this. They see the page a tap opens; the dashboard is how you know what they did with it.
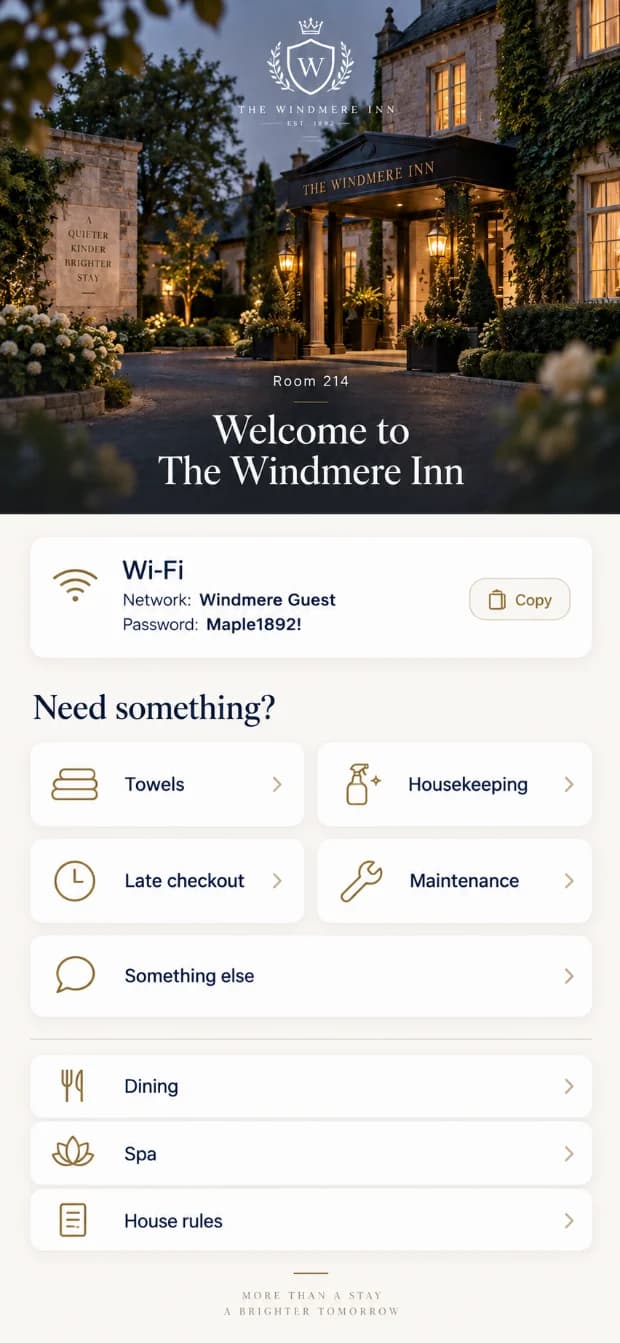

What a tap opens. 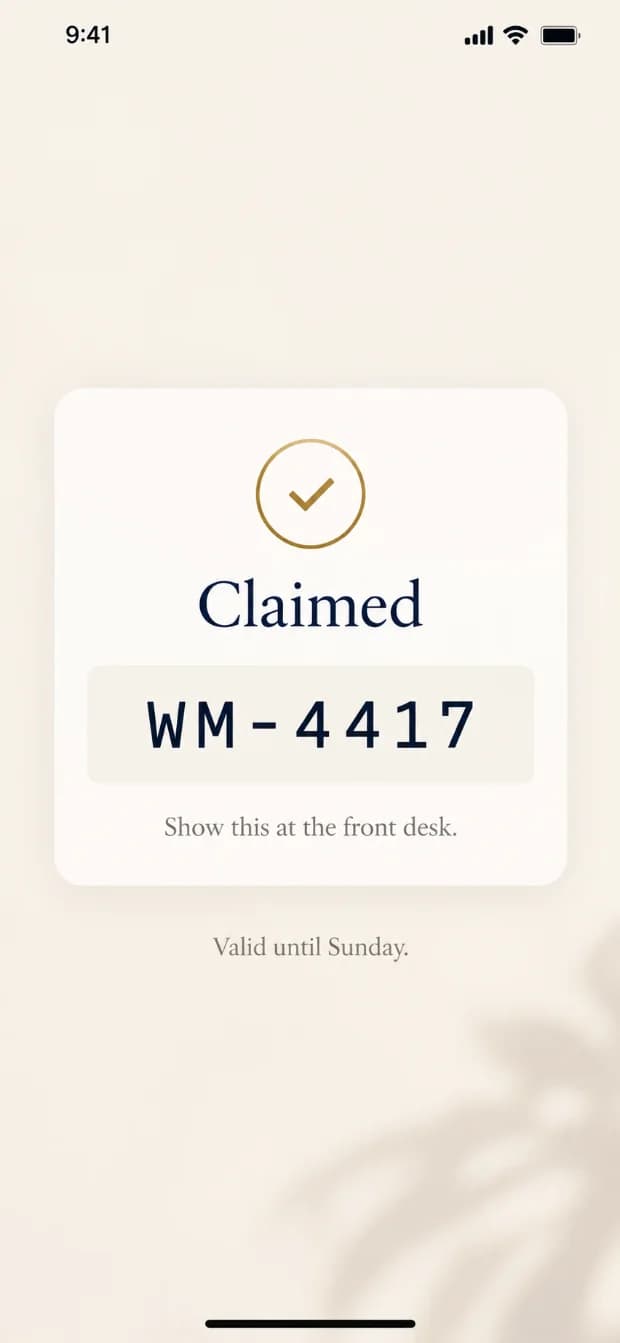
An offer, claimed. The claim and the redemption are counted apart.
What the hotel sees
Taps by touchpoint and by day, requests with how long each took to handle, offers claimed against redeemed, and sign-ups with the consent wording each guest agreed to. Export any of it as CSV or JSON.A dashboard and a printable report each month, with fuller plans adding busy days and times and which tags led to a sign-up, a request or an offer claim. See pricing.
Example data.
Busy days
When guests actually tap.
- Four weeks at a glance, Monday to Sunday, with the count on every square.
- The colour is a second way of reading it, never the only one.
- A quiet Tuesday is as useful to see as a busy Saturday.
- Busy days and times are part of our fuller plans.
Four weeks, Monday to Sunday.
What's counted, and what isn't
Counted
Taps, requests, offer claims, redemptions and sign-ups — each one something that happened.
Not counted
Nothing is modeled, estimated or projected. A figure you set yourself, such as an offer's value, is shown as yours, and where we can't measure something the page says so.